Trading strategies can be misled by using only traditional Level 1 Data: Level 3 Data reveals how.
First published in Tabb Forum, December 2021
Author: Arnaud Bossard
Arnaud Bossard, Data Scientist, BMLL, analysed Italian stock Banco BPM (Ticker BAMI), trading on Borsa Italiana (XMIL). By comparing Level 1 and Level 3 Data metrics, it becomes clear that Level 1 Data metrics provide only a partial view, but more of a concern is that insights from Level 1 Data metrics can be misleading. It is necessary to look at the depth of the order book and Level 3 Data to truly understand market behaviour.
In order to achieve best execution and maximise trading performance, it is essential to understand and account for tick sizes, and the impact that they have on liquidity. However, with a myriad of different tick size regimes and regulations across geographies and asset classes, this can be difficult. At the same time, many market participants are still using Level 1 Data (best bid and offer prices and sizes) for trading, research and analysis. The combination of Level 1 Data and dynamic tick size rules can lead to incorrect conclusions about the true availability of passive liquidity. It is only with Level 3 Data, which captures the full detail of every order, that the picture becomes clear.
This article will focus on European equities. Under MIFID II, European equities have a consistent, dynamic tick size across venues. This means the tick size of a stock changes based on its price, with tick sizes set by the European Securities and Markets Authority (ESMA).
Taking one example - a liquid Italian stock, Banco BPM (Ticker BAMI), trading on Borsa Italiana (XMIL) - we look at a Level 1 Data metric and compare it with a similar metric with more depth. We find a paradox. It's only when we look deeper using Level 3 Data that the answer becomes clear.
The First Observation: Looking at a Level 1 Data metric, the average notional value at touch (top of the order book) (Exhibit 1), we see a clear jump on 5 February 2021, which remains higher thereafter. This typically indicates an increase in liquidity, leading a participant to think the stock has become more liquid.
Exhibit 1: Evolution of the available notional at touch (Level 1 Data) and available notional at 10 bps from the midpoint in Euros (Level 2 Data)
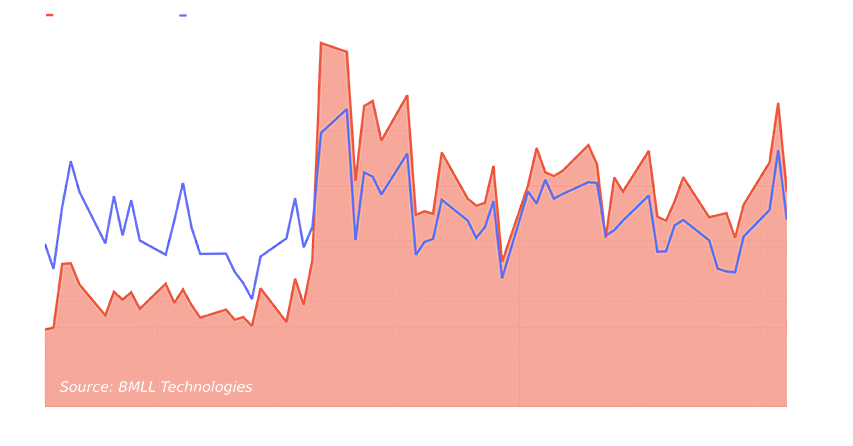
The Paradox: If we now look at the notional value available up to 10 bps from the midpoint, a Level 2 Data metric (Exhibit 1), on the same dates, the liquidity appears to remain constant, suggesting there has been no change in liquidity. How is this compatible with the previous observation, and has the liquidity actually changed?
The Answer: When we observe the price for BAMI over the same time, a Level 1 Data metric (Exhibit 2), we see a clear upwards trend, with that price crossing the €2 mark on 5 February. As a consequence, the tick size changed from €0.0005 to €0.001.
Observing the effect on the Limit Order Book (LOB) sheds light on the situation.
Exhibit 2: PST Price evolution (Level 1 Data)

In the two plots below, a Level 3 Data metric (Exhibit 3), we see a change in the structure of the order book. On the first plot, we see price levels every 0.0005, and on the second plot, after the tick size change, we see levels every 0.001. Looking at the volume, we see that participants place more orders per price level to compensate. For example, the total volume of the orders at the top Bid on plot two is approximately the sum of the volume of the first two Bid levels on plot one.
This explains the paradox. There is no change in liquidity - participants have tuned their liquidity to match the changing tick sizes. By using the insight that Level 3 Data provides, the story is now clear.
Exhibit 3: LOB Level 3 at dates before and after 5 February 2021 (Bid = green, Ask = red) (Level 3)


We also see that the spread changes from two ticks to one tick. We confirm this in the plot below, a Level 1 Data metric (Exhibit 4). There is a clear transition for the average spread in ticks, but the average spread in bps does not change.
Exhibit 4: Spread (Level 1)

Conclusion: Using only Level 1 Data metrics may be misleading. When the tick size changes, market participants finely adjust their trading to maintain a level of liquidity. It is only through analysis of the Level 3 orderbook that this paradox becomes apparent.
The So What: This example illustrates that looking at Level 1 Data metrics provides only a partial view, but more of a concern is that insights from Level 1 Data metrics can be misleading. It is necessary to look at the depth of the order book and Level 3 Data to truly understand market behaviour.