BMLL Market Lens: European Liquidity Maps provides insight into the fragmentation of European equity markets via a view of all Cboe Europe All Companies index constituents across the major European trading and execution venues over a rolling 12-month period. The charts are updated monthly and show both a consolidated view and a granular breakdown of liquidity on all trading mechanisms.
Using your mouse, interact with the plots to explore key trends in European liquidity, or download any chart by clicking on the camera icon in the top-right corner of the graph.
Part 1 - Fragmentation of Liquidity across Europe
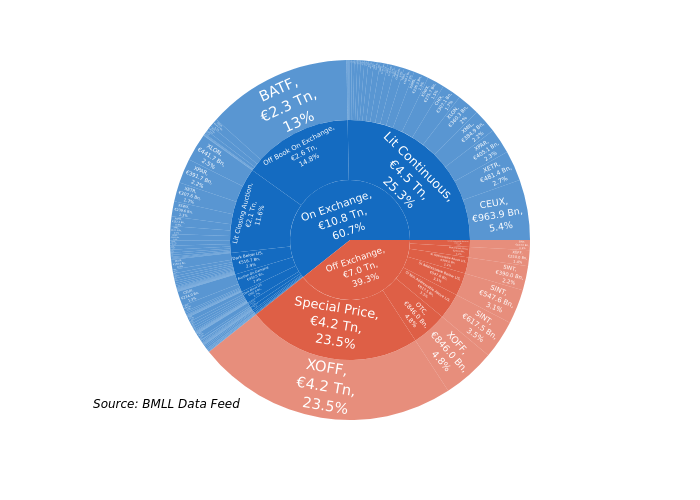
Figure 1 - A consolidated view of European liquidity
A consolidated view of the European Trading Landscape is essential to truly understand where both addressable and non-addressable liquidity resides. A granular breakdown of liquidity fragmentation and market share across the last 12 -months allows market participants to gain this vital insight.
Click to interact:
For interactive charts, open this page on desktop
Note: click on the centre of the chart to return to the previous view.
Part 2 - Analysing liquidity across different trading mechanisms
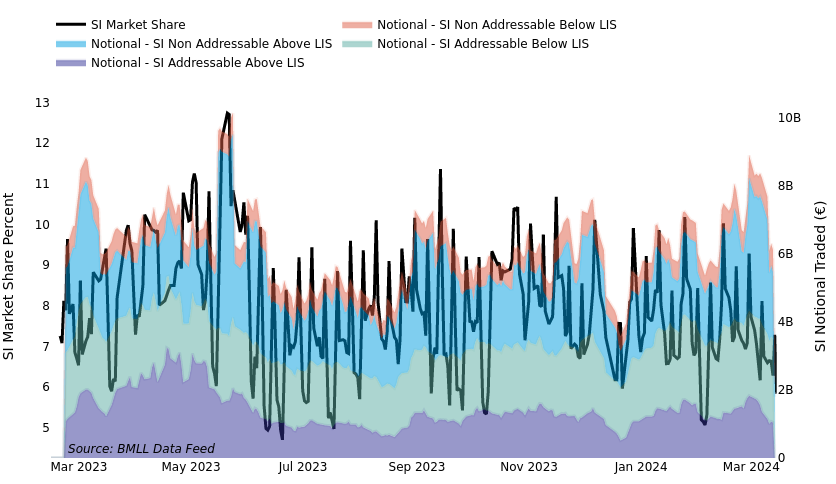
Figure 2.1 - What are the key trends across SIs?
Systematic internalisers (SIs) are widely regarded as effective liquidity discovery tools for market participants. BMLL provides an overview of SI market share and a clear breakdown of volumes traded across its constituent parts.
For interactive charts, open this page on desktop
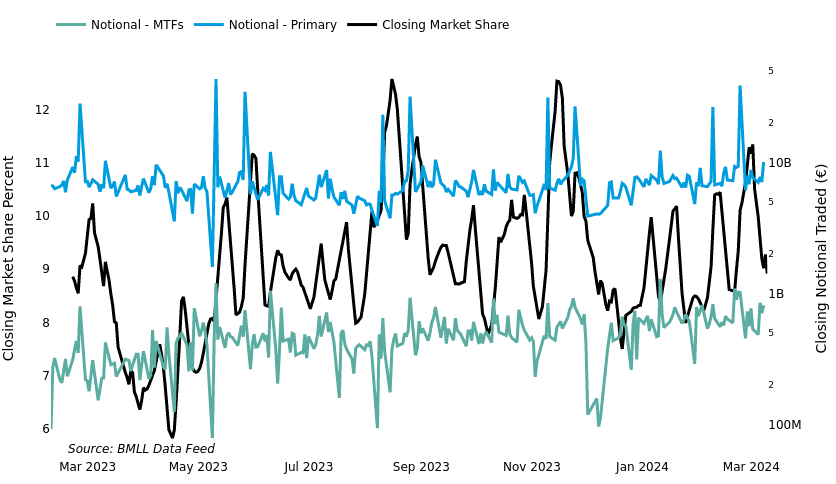
Figure 2.2 - Where can end-of-day liquidity be found?
Offered to enhance liquidity discovery after the price formation at the close, Trade At Last and Closing Auction mechanisms have become more prevalent. A clear view of the volumes traded through these mechanisms enables participants to effectively interact with the closing price.
For interactive charts, open this page on desktop
Note: the y-axis is logarithmic.
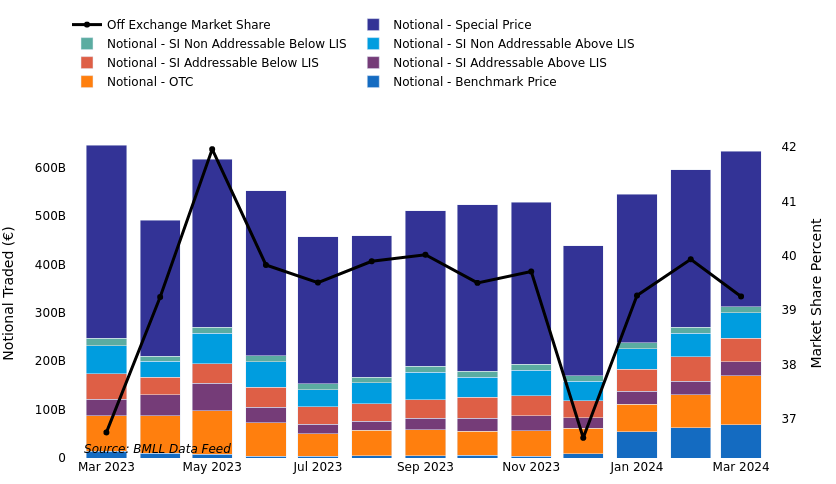
Figure 2.3 - How critical is off-exchange trading to a consolidated view of liquidity?
Over-The-Counter (OTC) trading plays an important function in the European capital markets as a mechanism by which securities are traded. However, unlike trading on a lit order book, not all trading is addressable to all participants. Therefore, it is crucial to understand Europe's true addressable liquidity profile.
For interactive charts, open this page on desktop
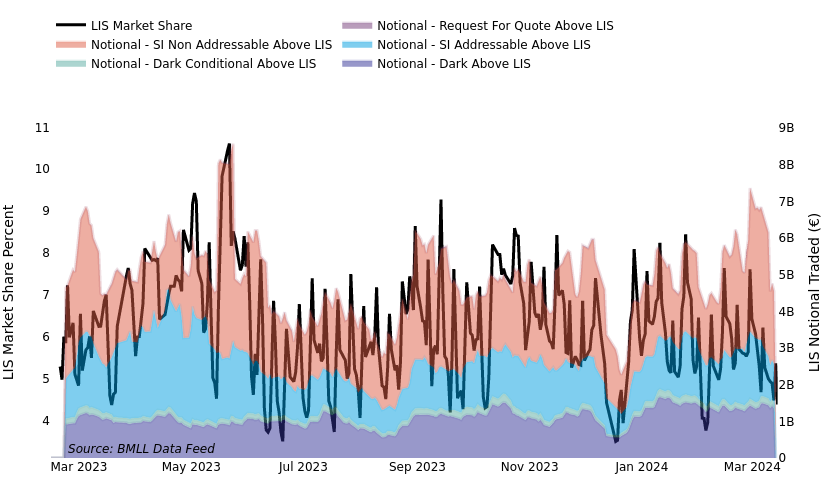
Figure 2.4 - What are the key patterns in LIS trading?
The Large-In-Scale (LIS) threshold reduces the market impact of large orders by allowing participants to waive and defer pre- and post-trade reporting. Understanding the trend in above LIS volumes across different trading mechanisms enables market participants to improve liquidity discovery and achieve optimal execution strategy.
For interactive charts, open this page on desktop
Methodology:
To offer participants a consolidated view of European liquidity, BMLL considers all trades across all Cboe Europe All Companies index constituents on all primary European venues, MTFs, Dark Pools, APAs, and all on- and off-book trading over the last 12 months. Once captured, all individual trade fields are combined with the market state and the venue to produce the most granular possible view of liquidity.
All data seen above is available via the BMLL Data Feed. Click here to read more about Daily Classified Trades.
Please contact us if you would like further information about Daily Classified Trades or the methodology used.
Click here to read BMLL Market Lens: US Liquidity Maps.